Case Study: VA HIT Modernization Journey Mapping
DISCLAIMER: In compliance with my Non-Disclosure, Intellectual Property, Copyright and Social Media agreements, the information provided in this case study is limited to material that has been previously published in public forums, as approved by my customer and/or my employer. While this case study represents my work and the work of my team, I am extremely limited in what I can share on this website. Graphics in this case study are intentionally obscured. If this case study interests you, please connect with me privately for additional discussion.
Summary
The objective of this project was to visualize a series of Veteran Health Administration (VA) outpatient clinical encounters from the perspectives of three different people. In this manner, we hoped to identify innovative solutions to pain points that would produce the best experience for all individuals involved and then communicate this information to decision makers. We chose to use journey mapping to visualize and communicate these experiences.
The Challenge
Information Technology (IT) development teams and executives make decisions on a daily basis that form the experience of the people experiencing these clinical encounters, including the patient and his or her care team. A lot of valuable information is available. But, it isn’t provided in an easily digestible and accessible form to help decision makers understand how opportunities or compromises in Health Information Technology (HIT) investment could affect the vision of the ideal to-be experience, specifically the prioritization of the modernization of VA’s Electronic Health Record (EHR). Developing and sharing these journey maps helps to bridge this gap.
The Approach
This project employed literature consultation, rapid ethnography, interviews and unmoderated questionnaires to collect qualitative information. This qualitative information was used to produce a rich narrative of the storyline, which was reviewed by clinical Subject Matter Experts (SMEs). Supporting information for each event, including touchpoints, was collected or generated and then visualized in the form of journey maps.

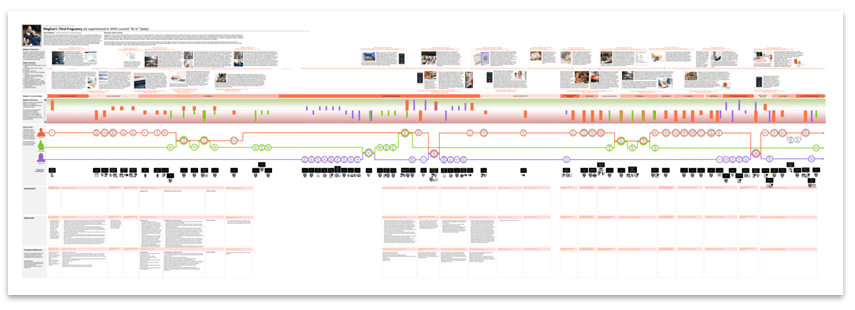
Figure 1: Example of the Visualization of a Journey Map. This journey map was developed to explore provider and Veteran needs for Primary Care and Women’s Health services delivery. The map includes visualization of the rich narrative in timeline form, vertically aligned with the emotional experiences, touchpoints and HIT as depicted in a service flow.
The team produced a coordinated package of maps of the experiences of three people (represented as validated personas). All maps depicted the same health need for one Veteran patient and mapped her perspective along with that of two VHA staff members involved in delivering her care.
- Meghan: Post-9/11 female Veteran experiencing the early pregnancy of her third child with her new husband, who is active duty Navy. The journey is triggered with the pregnancy diagnosis and proceeds through the resolution of a teratogenic drug issue resulting in a seizure at approximately 8 weeks post-conception.
- Dr. Francis: Meghan’s Primary Care Provider.
- Vera, RN: Meghan’s Maternity Care Coordinator.
The package contained 6 maps. Each person’s journey was mapped to show their experience in VA’s current “as-is” state and their experience in a future envisioned “to-be” state, along with the supporting HIT resources for both.
The Solution
These maps help ensure that users are at the center of VA’s organizational thinking as new Electronic Health Record (EHR) components are acquired, customized, built and/or integrated. All maps in the package are centered on the Veteran health need and the comprehensive Veteran experience through a series of diverse encounters. As such, the maps will continually encourage consideration and balance of users’ questions and needs throughout decision making at all levels.
- Executives and other managers can use the journey maps to identify potential infrastructure capabilities needed to deliver on the future vision and make more informed decisions on impacts associated with necessary compromises in funding specific HIT investments.
- HIT managers can use them to gain a more holistic view of the user experience, helping them to identify areas to improve and drive organizational impact.
- Software designers and developers can use them to gain perspective on the motivations and constraints of the users of their products, resulting in a stronger empathetic bond that can translate into better software design decisions and compromises. These teams can also use the maps to prioritize fixes or enhancements and plan the roll-out of future HIT products or enhancements based on user needs.
- Teams can use the maps to help inform communications intended for users of the systems, as well as oversight bodies, such as Congress.
In one example, the “as is” maps can be aligned with the “to be” maps to make comparisons. The maps show “Moments of Truth,” critically charged touchpoints that have potential to significantly affect the experience of the individual over the journey as a whole (either positively or negatively). MoTs can be examined for opportunities that could be prioritized above others. Using MoTs, a new VA technology was envisioned for the “to be” state as a virtual assistant, lending the power of computing to the talents of the humans. It is presented as its own touchpoint service flow and demonstrates how the experience could be improved for Veterans and clinicians with changes in all aspects of clinical experiences, including policies, procedures and supporting HIT products (hardware and software investments). These improvements directly impact the overall pattern in emotions, which can be seen as more pleasant in the “to be” experience than in the “as is.”
In another example, when maps are paired to provide the perspectives of the variety of people experiencing the same series of events, opportunities and compromises can be more thoughtfully considered, while continually accelerating decision making and innovation. The “as is” state maps for all three personas are aligned vertically to produce an even larger alignment diagram.

Figure 2: Alignment of Three Journey Maps to Produce a Meta Alignment Diagram. Here, the maps show how, while Meghan is celebrating her pregnancy, Dr. Francis is struggling with the challenges of her workload (which caused the delay in notifying Meghan), and Vera is anxiously digging through the electronic health record for the orders from Dr. Francis to assist Meghan in acquiring maternity care from a community provider.
In this way, specific areas can be explored to fully understand the experience from multiple perspectives. In this way, a designer can accommodate all sociotechnical aspects of the experience when preparing to propose a new solution that must support needs of all personas.
The Impact
Journey maps of clinical scenarios done in this way can support prioritization of business process re-engineering needs, process improvement projects, and health information technology development. This particular package of maps is being used for EHR Modernization prioritization activities.
Details for this Case Study
| When | 2017-2018 |
| My Role | Validation Study Lead, Lead Journey Mapping Designer, User Research Support |
| Our Team | Nancy Wilck, Jennifer Herout, Kyle Maddox, John Brown, Jolie Dobre, Abigail Noonan, Robert Gluck, Evangelene Walters |
| Our Methods | Literature Consultation, Rapid Ethnography, Interviews, Unmoderated Questionnaires, Data Visualization, Persona Development, Journey Mapping, Focus Groups (moderated in person and remote moderated) |
| Our Tools | MS Office (Access, Visio, Excel, PowerPoint and Project), MS Power BI, Adobe Creative Suite (Acrobat and InDesign), SurveyMonkey, FocusGroupIt, Morae, Web Conferencing (WebEx) |
Publications Related to this Case Study
Information in this case study was presented as a poster at the 2017 HSR&D/QUERI National Conference (view the poster) and as a featured article in the VHA Human Factors Quarterly Newsletter (Winter 2018).